 |
Evolife
Evolife has been developed to study Genetic algorithms, Natural evolution and behavioural ecology.
|
|
Evolife
Evolife has been developed to study Genetic algorithms, Natural evolution and behavioural ecology.
|
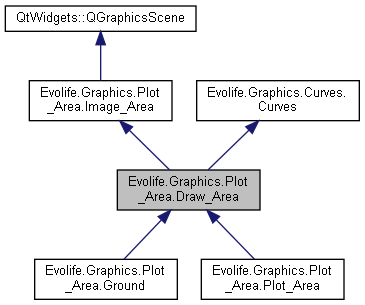
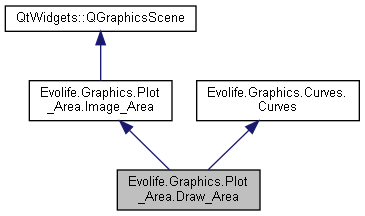
Draw_Area: Basic drawing Area. More...
Public Member Functions | |
| def | __init__ (self, image=None, width=400, height=400, EventInterpreter=None, zoom=1) |
| Calls Image_Area constructor Initializes Curves. More... | |
| def | set_margins (self, Left, Right, Bottom, Top) |
| surrounding margins (in Image_Area pixels) More... | |
| def | init_Pens (self) |
| Defining one pen and one QPainterPath per curve. More... | |
| def | grid (self) |
| Initial display - to be overloaded. More... | |
| def | pixel2xy (self, Point) |
| converts physical coordinates into logical pixel(between 0 and scaleX) More... | |
| def | xy2pixel (self, Point) |
| converts logical pixel (between 0 and scaleX) into physical coordinates through rescaling More... | |
| def | convert (self, Point) |
| Conversion of logical coordinates into physical coordinates through scaling and margin translation. More... | |
| def | Q_Convert (self, Point) |
| Conversion of Point into Qt point. More... | |
| def | draw (self, oldpoint, newpoint, Width=3, ColorID=0, Tag='') |
| adds a segment on a given curve More... | |
| def | drawTo (self, newpoint, Width=3, ColorID=0, Drawing=True, Tag='') |
| draws an additional segment on a given curve (from the end of the previous one) More... | |
| def | erase (self) |
| erase curves, items and restore grid More... | |
| def | redraw (self) |
| the whole picture is redrawn when the scale changes More... | |
| def | reframe (self, Point, Anticipation=False) |
| performs a change of scale when necessary More... | |
| def | plot (self, Curve_designation, newpoint, Width=3) |
| draws an additional segment on a curve More... | |
| def | move (self, Curve_designation, newpoint) |
| introduces a discontinuity in a curve More... | |
 Public Member Functions inherited from Evolife.Graphics.Plot_Area.Image_Area Public Member Functions inherited from Evolife.Graphics.Plot_Area.Image_Area | |
| def | __init__ (self, image=None, width=1000, height=1000, EventInterpreter=None, zoom=1) |
| Inherits from QGraphicsScene. More... | |
| def | resize (self, w, h) |
| Stores new dimensions and redraws. More... | |
| def | dimension () |
| returns dimensions More... | |
| def | redraw (self) |
| the whole scene is redrawn when the scale changes More... | |
| def | drawPoints (self) |
| Unused ---— just for test. More... | |
| Public Member Functions inherited from Evolife.Graphics.Curves.Curves | |
| def | __init__ (self) |
| Creates a list of curves matching all available Evolife colours. More... | |
| def | start_Curve (self, Curve_id, location) |
| defines where a curve should start More... | |
| def | CurveAddPoint (self, Curve_id, Point, Draw=True) |
| Adds a point to a Curve. More... | |
| def | Curvenames (self, Names) |
| records names for Curves. More... | |
| def | ActiveCurves (self) |
| returns actually used curves More... | |
| def | Legend (self) |
| returns tuples (ID, colour, colourname, curvename, legend) representing active curves More... | |
| def | dump (self, ResultFileName=None, ResultHeader='', DumpStart=0) |
| Saves Curves to a file. More... | |
Public Attributes | |
| OrigineX | |
| OrigineY | |
| scaleX | |
| scaleY | |
| LeftMargin | |
| RightMargin | |
| BottomMargin | |
| TopMargin | |
| Pens | |
| change | |
| Public Attributes inherited from Evolife.Graphics.Plot_Area.Image_Area | |
| ScaledBoard | |
| Board | |
| fitSize | |
| Canvas | |
| W | |
| H | |
| FrameNumber | |
| EventInterpreter | |
| zoom | |
| Public Attributes inherited from Evolife.Graphics.Curves.Curves | |
| Colours | |
| Curves | |
| UsedCurves | |
Draw_Area: Basic drawing Area.
Definition at line 159 of file Plot_Area.py.
| def Evolife.Graphics.Plot_Area.Draw_Area.__init__ | ( | self, | |
image = None, |
|||
width = 400, |
|||
height = 400, |
|||
EventInterpreter = None, |
|||
zoom = 1 |
|||
| ) |
Calls Image_Area constructor Initializes Curves.
Reimplemented from Evolife.Graphics.Curves.Curves.
Reimplemented in Evolife.Graphics.Plot_Area.Ground, and Evolife.Graphics.Plot_Area.Plot_Area.
Definition at line 163 of file Plot_Area.py.
| def Evolife.Graphics.Plot_Area.Draw_Area.convert | ( | self, | |
| Point | |||
| ) |
Conversion of logical coordinates into physical coordinates through scaling and margin translation.
Reimplemented in Evolife.Graphics.Plot_Area.Ground.
Definition at line 223 of file Plot_Area.py.
| def Evolife.Graphics.Plot_Area.Draw_Area.draw | ( | self, | |
| oldpoint, | |||
| newpoint, | |||
Width = 3, |
|||
ColorID = 0, |
|||
Tag = '' |
|||
| ) |
adds a segment on a given curve
Definition at line 236 of file Plot_Area.py.
| def Evolife.Graphics.Plot_Area.Draw_Area.drawTo | ( | self, | |
| newpoint, | |||
Width = 3, |
|||
ColorID = 0, |
|||
Drawing = True, |
|||
Tag = '' |
|||
| ) |
draws an additional segment on a given curve (from the end of the previous one)
Definition at line 246 of file Plot_Area.py.
| def Evolife.Graphics.Plot_Area.Draw_Area.erase | ( | self | ) |
erase curves, items and restore grid
Reimplemented in Evolife.Graphics.Plot_Area.Ground.
Definition at line 259 of file Plot_Area.py.
| def Evolife.Graphics.Plot_Area.Draw_Area.grid | ( | self | ) |
Initial display - to be overloaded.
Reimplemented in Evolife.Graphics.Plot_Area.Plot_Area, and Evolife.Graphics.Plot_Area.Ground.
Definition at line 202 of file Plot_Area.py.
| def Evolife.Graphics.Plot_Area.Draw_Area.init_Pens | ( | self | ) |
Defining one pen and one QPainterPath per curve.
Definition at line 189 of file Plot_Area.py.
| def Evolife.Graphics.Plot_Area.Draw_Area.move | ( | self, | |
| Curve_designation, | |||
| newpoint | |||
| ) |
introduces a discontinuity in a curve
Definition at line 320 of file Plot_Area.py.
| def Evolife.Graphics.Plot_Area.Draw_Area.pixel2xy | ( | self, | |
| Point | |||
| ) |
converts physical coordinates into logical pixel(between 0 and scaleX)
Definition at line 207 of file Plot_Area.py.
| def Evolife.Graphics.Plot_Area.Draw_Area.plot | ( | self, | |
| Curve_designation, | |||
| newpoint, | |||
Width = 3 |
|||
| ) |
draws an additional segment on a curve
Reimplemented in Evolife.Graphics.Plot_Area.Plot_Area.
Definition at line 306 of file Plot_Area.py.
| def Evolife.Graphics.Plot_Area.Draw_Area.Q_Convert | ( | self, | |
| Point | |||
| ) |
Conversion of Point into Qt point.
Definition at line 229 of file Plot_Area.py.
| def Evolife.Graphics.Plot_Area.Draw_Area.redraw | ( | self | ) |
the whole picture is redrawn when the scale changes
Reimplemented from Evolife.Graphics.Plot_Area.Image_Area.
Reimplemented in Evolife.Graphics.Plot_Area.Ground.
Definition at line 270 of file Plot_Area.py.
| def Evolife.Graphics.Plot_Area.Draw_Area.reframe | ( | self, | |
| Point, | |||
Anticipation = False |
|||
| ) |
performs a change of scale when necessary
Definition at line 281 of file Plot_Area.py.
| def Evolife.Graphics.Plot_Area.Draw_Area.set_margins | ( | self, | |
| Left, | |||
| Right, | |||
| Bottom, | |||
| Top | |||
| ) |
surrounding margins (in Image_Area pixels)
Definition at line 181 of file Plot_Area.py.
| def Evolife.Graphics.Plot_Area.Draw_Area.xy2pixel | ( | self, | |
| Point | |||
| ) |
converts logical pixel (between 0 and scaleX) into physical coordinates through rescaling
Definition at line 214 of file Plot_Area.py.
| Evolife.Graphics.Plot_Area.Draw_Area.BottomMargin |
Definition at line 186 of file Plot_Area.py.
| Evolife.Graphics.Plot_Area.Draw_Area.change |
Definition at line 284 of file Plot_Area.py.
| Evolife.Graphics.Plot_Area.Draw_Area.LeftMargin |
Definition at line 184 of file Plot_Area.py.
| Evolife.Graphics.Plot_Area.Draw_Area.OrigineX |
Definition at line 169 of file Plot_Area.py.
| Evolife.Graphics.Plot_Area.Draw_Area.OrigineY |
Definition at line 170 of file Plot_Area.py.
| Evolife.Graphics.Plot_Area.Draw_Area.Pens |
Definition at line 192 of file Plot_Area.py.
| Evolife.Graphics.Plot_Area.Draw_Area.RightMargin |
Definition at line 185 of file Plot_Area.py.
| Evolife.Graphics.Plot_Area.Draw_Area.scaleX |
Definition at line 173 of file Plot_Area.py.
| Evolife.Graphics.Plot_Area.Draw_Area.scaleY |
Definition at line 174 of file Plot_Area.py.
| Evolife.Graphics.Plot_Area.Draw_Area.TopMargin |
Definition at line 187 of file Plot_Area.py.